Monitoring sensor values of an HP ProLiant MicroServer G7 N54L
I’m running a small Linux server (HP ProLiant MicroServer G7 N54L) in my home network as backup drive for desktops and notebooks. The health of the server is critical and therefore I wanted to keep track of some system metrics such as temperatures, voltages and system fan speed in the hope that they can detect hardware problems in advance.
These metrics are typically offered by hardware monitor chips and can
be accessed in Linux with the lm-sensors utilities (sensors-detect and
sensors). Unfortunately sensors-detect was not able to detect the
respective chip (Nuvotem/Winbond W83795ADG). After a bit of research, it
turned out that the SMBus/I2C driver for the chipset failed to detect the
sensor. Luckily there was already a patch available that fixed
the driver but supported only an older kernel version. The patch was never
merged into the mainline Linux kernel and meanwhile a few things have changed
in that module. Since I think it’s a valuable change, I ported it to the
current kernel version, cleaned it up and re-sent it to the
mailing list where it’s currently being reviewed. (UPDATE: The
patch has been merged and is included in Linux 4.5.)
For the time being, the patched driver can be found in this GitHub repository including a more detailed description and installation instructions. This should make it simple for anyone interested to test it and use it on their systems.
After installation of the updated driver and loading the modules, sensors is
able to show the measurements:
dg-i2c-1-2f
Adapter: SMBus PIIX4 adapter SDA2 at 0b00
Vcore:        +0.88 V  (min =  +0.50 V, max =  +1.40 V)
Vdimm:        +1.51 V  (min =  +1.42 V, max =  +1.57 V)
+3.3V:        +3.30 V  (min =  +2.96 V, max =  +3.63 V)
3VSB:         +3.26 V  (min =  +2.96 V, max =  +3.63 V)
System Fan:   679 RPM  (min =  329 RPM)
CPU Temp:     +34.8°C  (high = +109.0°C, hyst = +109.0°C)
                       (crit = +109.0°C, hyst = +109.0°C)  sensor = thermal diode
NB Temp:      +43.2°C  (high = +105.0°C, hyst = +105.0°C)
                       (crit = +105.0°C, hyst = +105.0°C)  sensor = thermal diode
MB Temp:      +20.8°C  (high = +39.0°C, hyst = +39.0°C)
                       (crit = +44.0°C, hyst = +44.0°C)  sensor = thermistor
The sensor readings can be easily aggregated with collectd’s sensor plugin. Unfortunately the current version of the plugin has one minor limitation and tracks the sensor readings only by metric names (e.g “temp1”) but not by the more descriptive labels (e.g. “CPU Temp”). To address this shortcoming I’ve created a pull request on GitHub. (UPDATE: The pull request has been merged and the feature is included in collectd 5.6.0.)
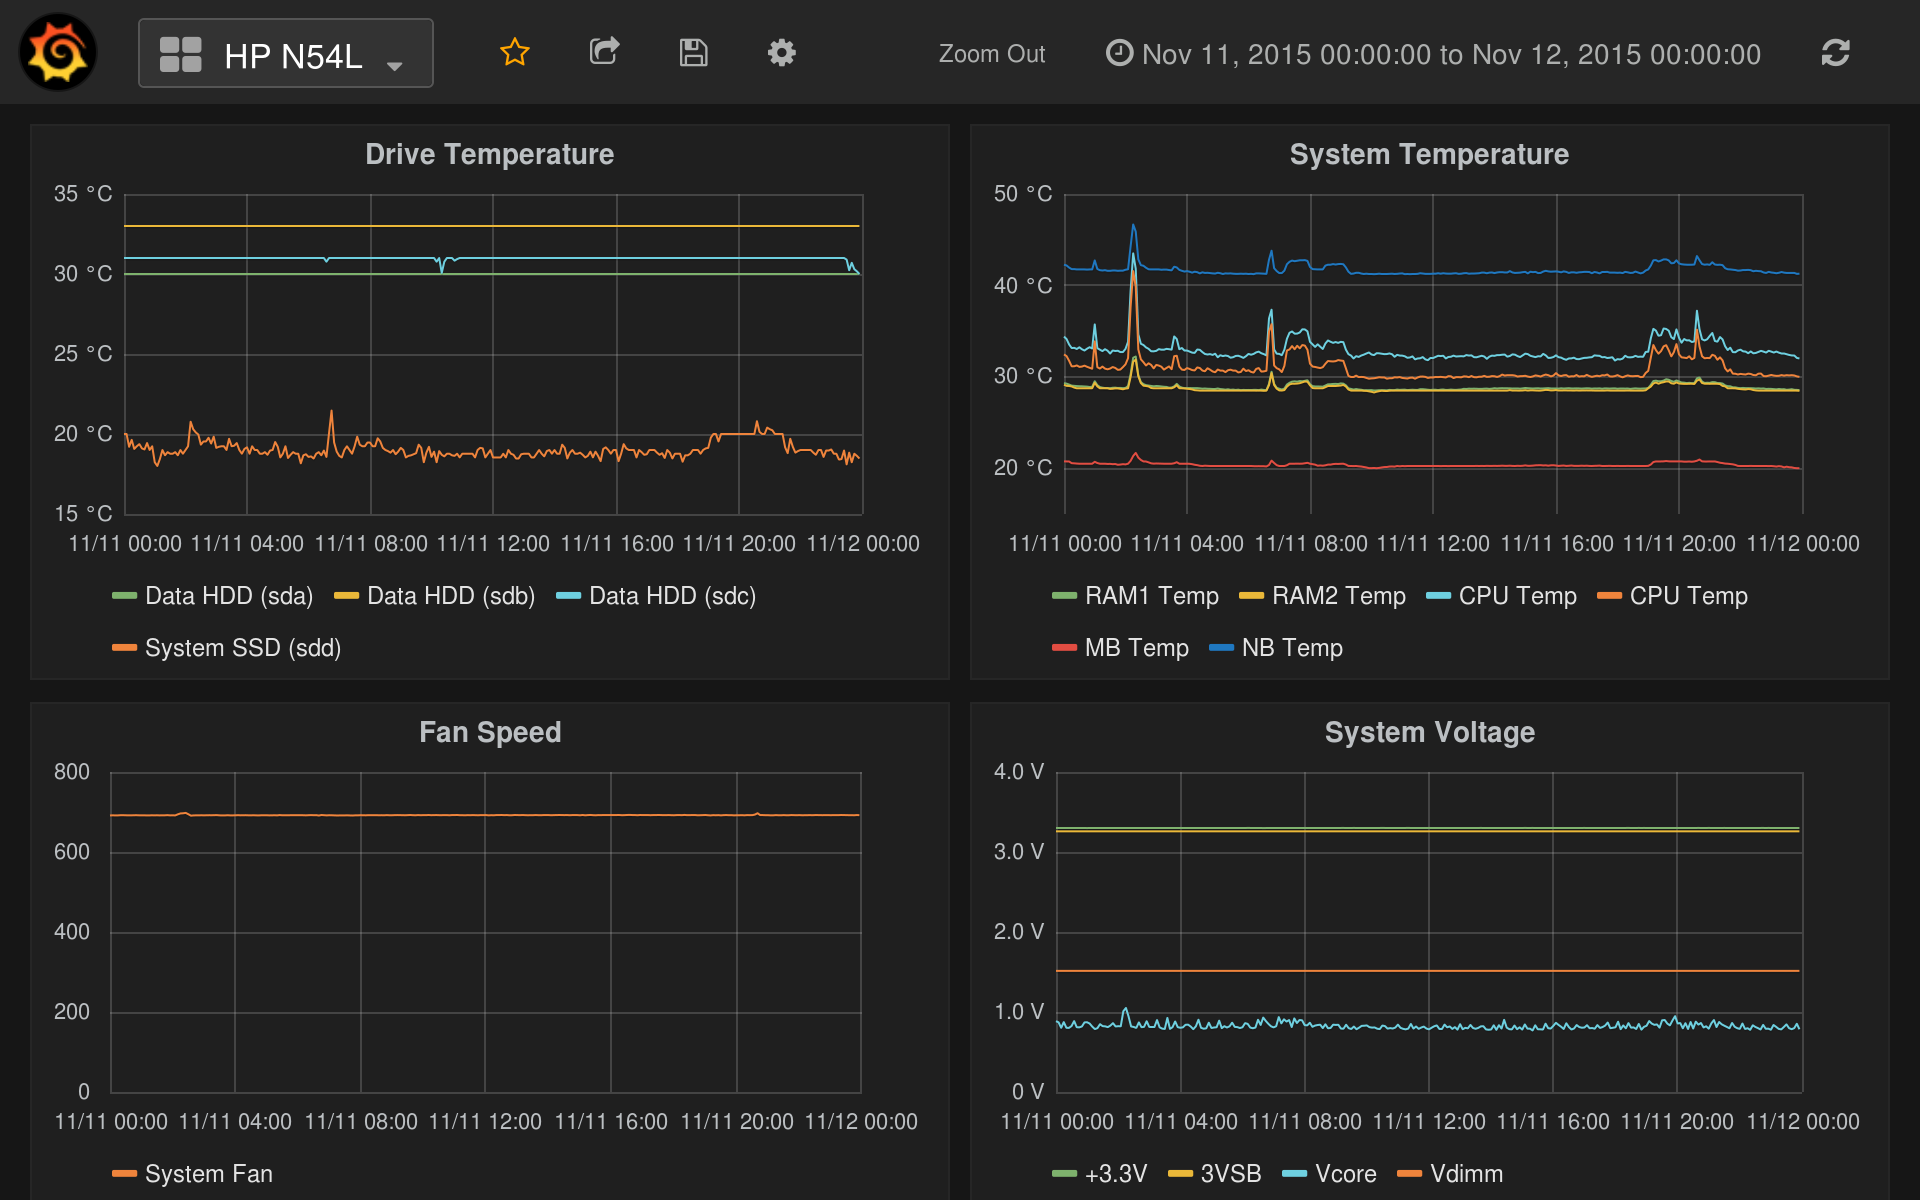
The following grafana screenshot shows the result:
The drive temperatures were collected using the HDDTemp plugin.
